
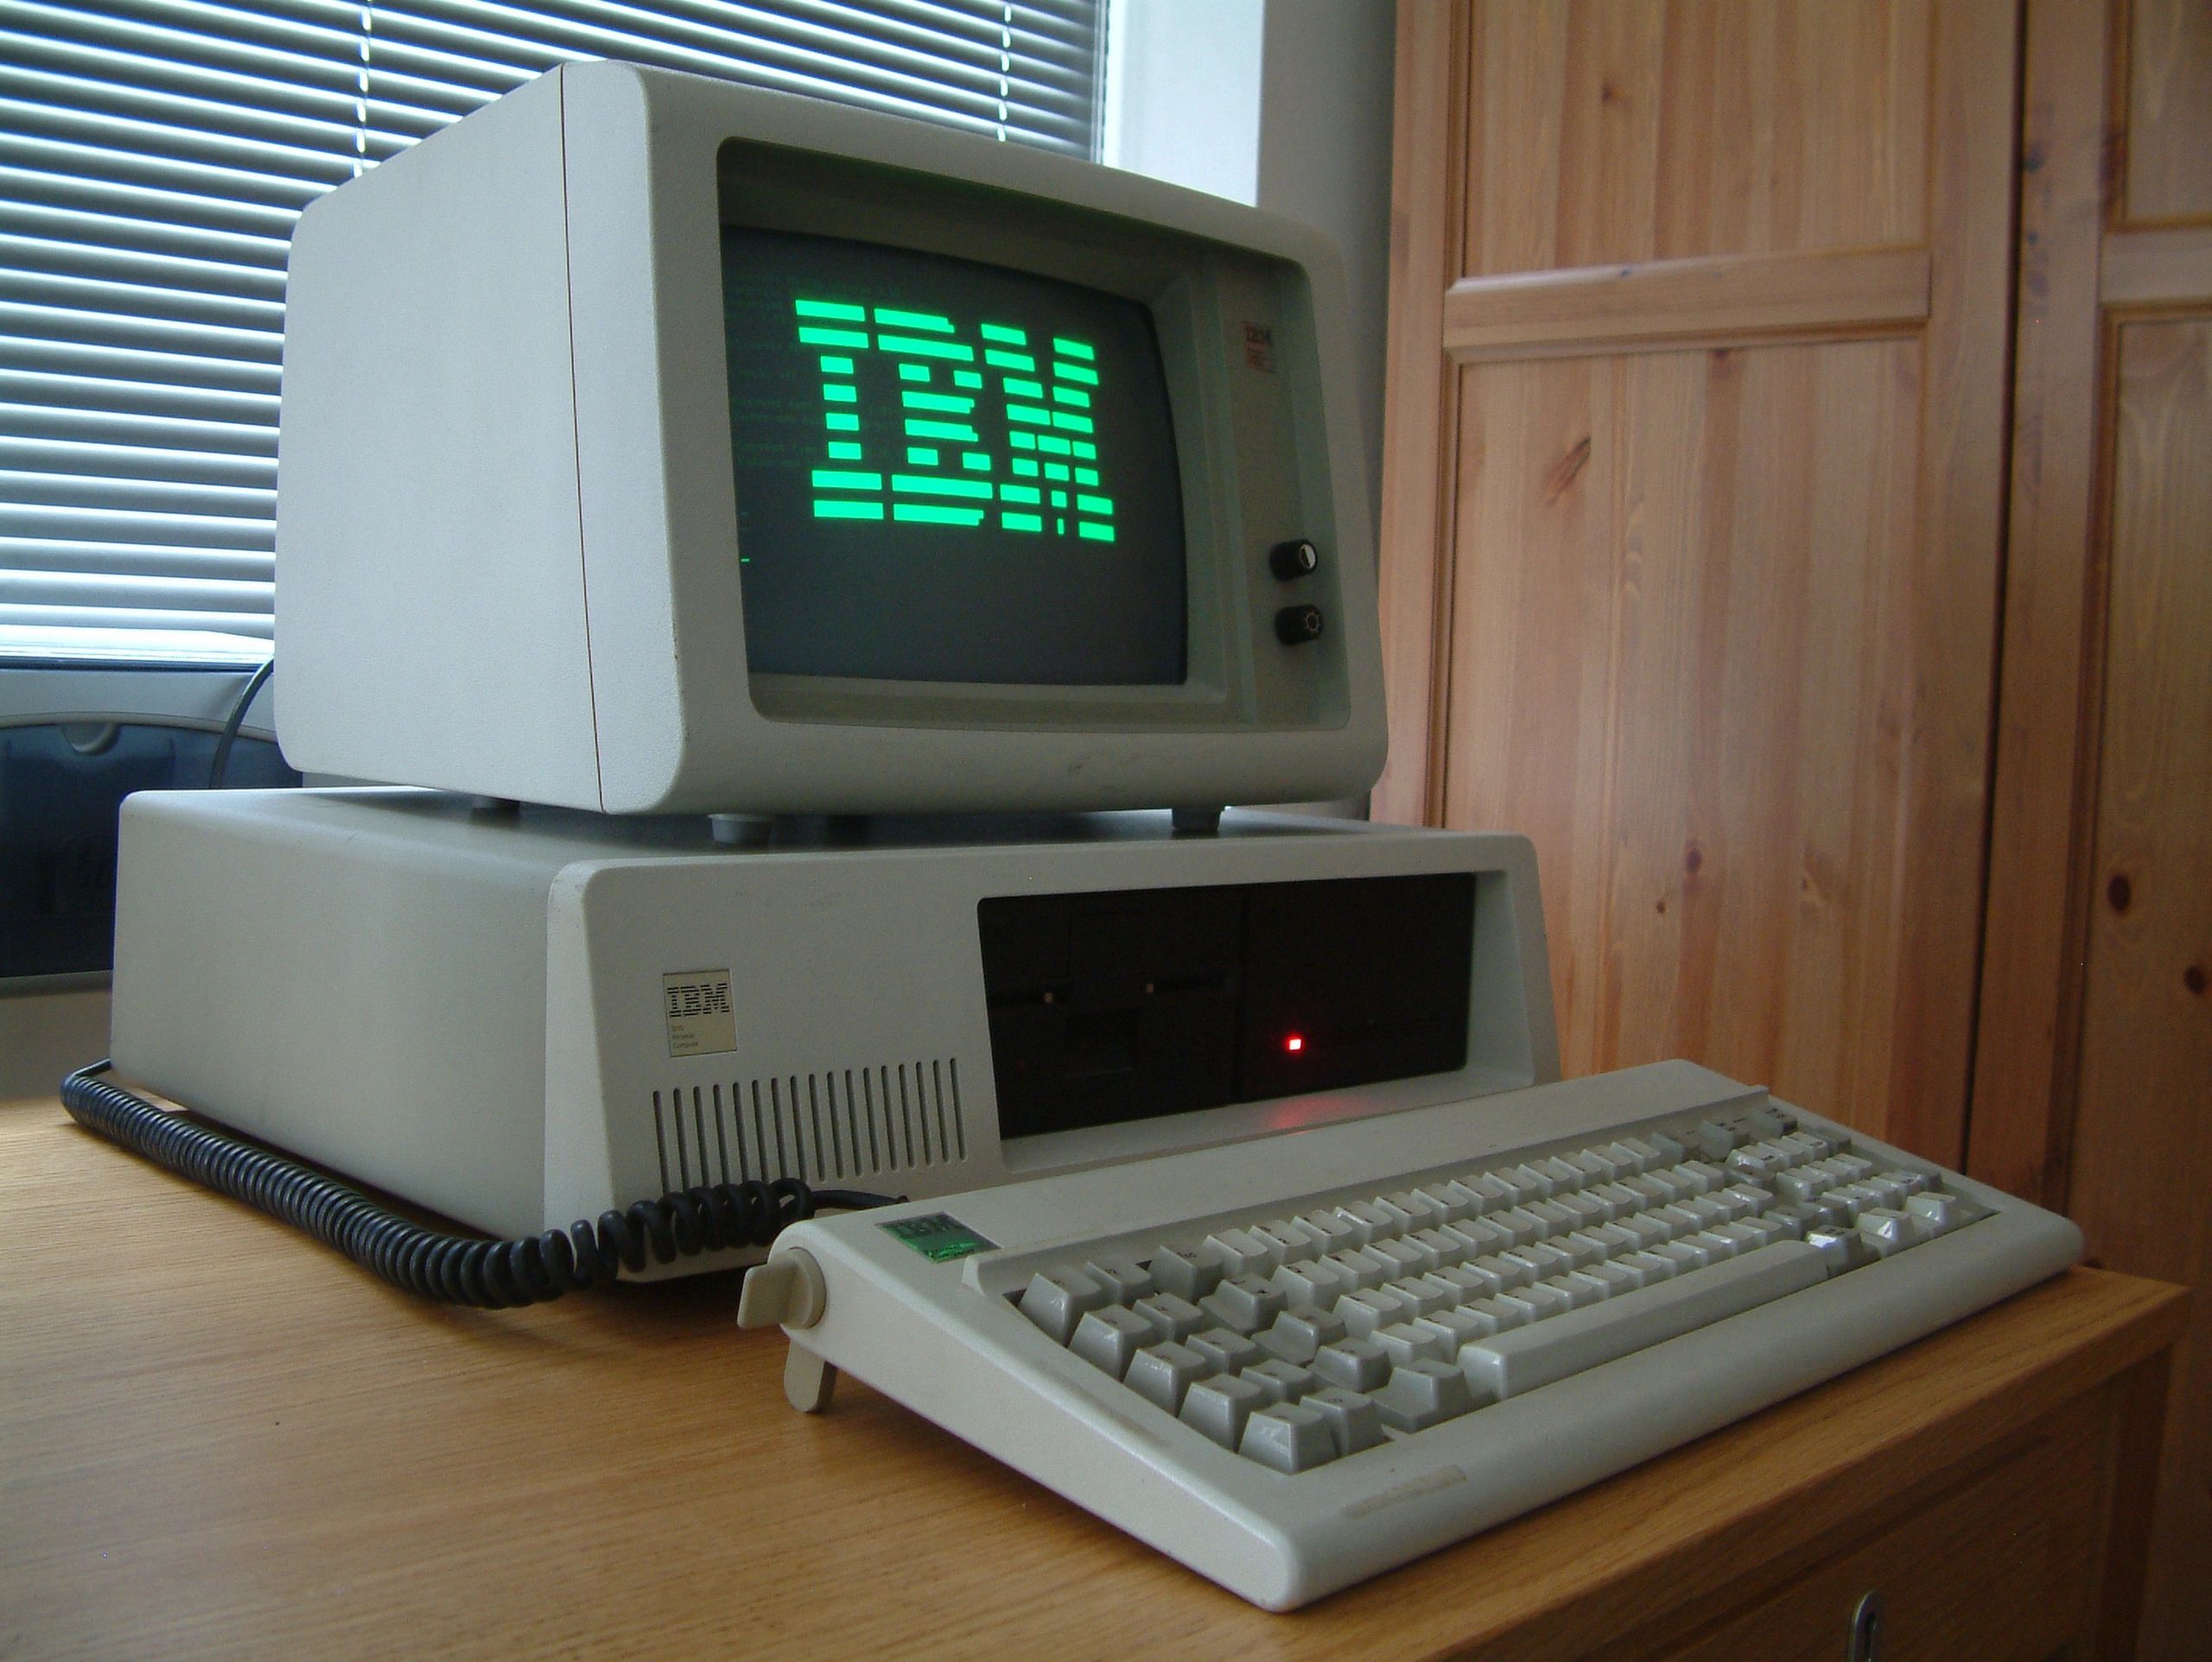
I still remember the computer that I purchased during my first year of college, back in the late 1980s. It was an IBM Personal Computer XT (PC XT). For those of you who aren’t as old as I am, or have not visited the Smithsonian recently, just check out some of the specs on this beast of a PC.
- Processor: 8088
- Speed: 4.77 MHz
- RAM: 64k - 640k
- Hard Drive: 10MB
Now, you may still be processing those specs in your brain (especially if your brain is powered by an 8088 processor), and be thinking that I made a typo on the hard drive size. But you read that correctly. 10MB. With an "M". Another tidbit that I should share is the price. I shelled out about $5000 for my first PC. Factoring in inflation, that $5000 in 1990 would equate to just under $10,000 in todays dollars That's a lot of ramen noodles for a college student.
Over time, I upgraded to a 286 and then a 386. Increasing the storage of the hard drive to 20MB and then a mind blowing 40MB in each of them respectivelly.
So why am I putting my age on display for all the world to see, and taking this trip down memory lane? (No, it's not because I am having a lucid moment). There are a couple of reasons, which are important in setting the stage for the rest of this blog post.
- To point out that just 30 years ago, we talked about data in Megabytes. Now, we describe data in Terabytes, Petabytes, and Zettabytes. What has happened between then and now?
- To illustrate the cost of these early systems because this too plays a role in the explosion of data. (This was just a personal computer. Imagine what a business server cost.)
The Rise of Data
Today, data is everywhere. It's created by almost every interaction that we have. Your online activity, business systems. sensor data, the Internet of Things, etc. are all generating huge amounts of data. But not only is the volume of data increasing, so is the velocity of data, which is the speed at which the data is created, as well as the variety of data that we see today. In fact, it is estimated that every day, 2.5 quintillion (2.5 exabytes) of data are created. That is 1,000,000,000,000,000,000. I know that this number may be difficult to wrap your mind around, so allow me to put it into perspective.
If you were to digitize every word that has ever been spoken, by every human being that has ever lived, it would only require about 5 exabytes to store. That is two days of data generation at our current velocity. Mind blown, right?
But the creation of data isn’t a linear event. The 3 Vs I've mentioned (volume, velocity, and variety) is increasing exponentially. (There are actually 7 'Vs' of big data*, but for the purposes of this blog, only 3 are required.) Consider the graphic below.
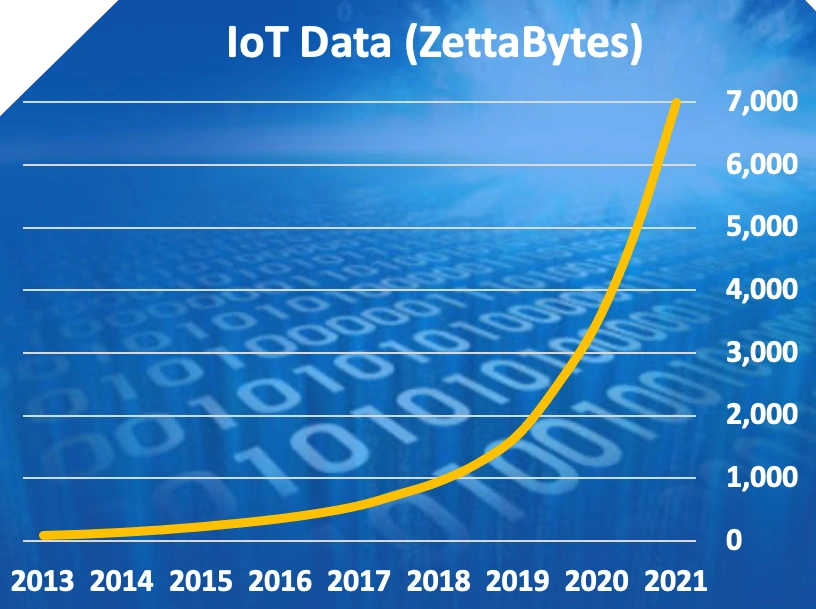
In 2018, the amount of data was doubling every 3 years. In 2020, that has increased to doubling every year, and as you can see, it will only continue to accelerate the pace. Another fun fact. Due to this ongoing, exponential growth, 90% of the data that exists today was created in the past 2 years!
So what caused this huge explosion of data? First, the democratization of computer hardware (i.e. servers, memory, storage, etc.) which are required to store and process this vast amount of data. Computer processors and architectures have also evolved which allow for complex calculations across these large sets of data. (Remember the specs and price on my first PC.) The decrease in the cost of hardware while simulataneously increasing capabilities has paved the way for many advancements that would have been unaffordable, and quite often impossible, in the past.
Back when I was still enjoying a bowl of 25 cent ramen noodles in college, the primary sources of data were business systems. (ERP systems, accounting packages, billing systems, HR systems, etc.) This data was typically stored within the four walls of the business, locked away inside databases and spreadmarts. (vast collections of spreadsheets). While the Internet had been invented, it wasn't available to the public until April 30, 1993 and it would be several more years before it began to gain traction. But once it did, things really began to take off.
Hit the fast forward button on your VCR and let's jump to today. While business systems still generate a lot of data, they have been dwarfed by the amount of data that is created via the Internet and all of the ancillary technologies that it has driven. Consider the Internet of Things (IoT). For those who have been living a sheltered life, or still working on a PC XT.
"The Internet of Things describes the network of physical objects - "things" - that are embedded with sensors, software, and other technologies for the purpose of connecting and exchanging data with other devices and systems over the Internet"
You may not be aware of just how connected you are, Outside of the obvious "things" such as Smart devices (I.e., Amazon Alexa, Nest, automated lights/cameras/plugs, etc.) you're connected in more ways than you might realize. A few examples. If you have a newer model car, chances are that it is capturing data and providing that information back to the manufacturer on the performance and maintenance of the vehicle. Your smart watch is also capturing data about you such as your location, biometrics, activity, etc. Geo-fencing may be occurring through your mobile device to target ads when you're near a particular store. Even your washing machine has sensors in it that are measuring things like load balance, spin speed, water level, loads washed, etc. (My washer will even text me when the load of laundry is complete. Unfortunately, it does not fold.) We really are living in a connected world, thanks to the Internet. No wonder some people wear tin foil hats!
As well, a major source of data creation comes from social media platforms such as FaceBook, Twitter, Instagram, etc. In fact, about 60% of all data generated today is created from users like you and I, the consumer. When you think about data, remember that it's not just text that you should be considering. It's also all of the images, sounds (music/voice), videos, etc. that are posted. This is all data. (structured, semi-structured, and unstructured data. Unstructured being the most common form of data created today, such as sound, images, and video.).
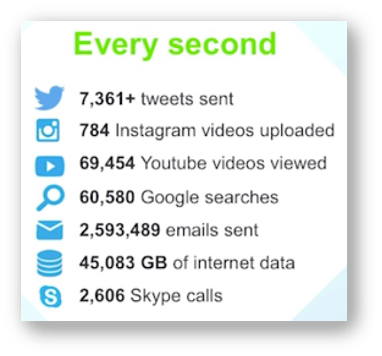
Here are a few more stats to give you a sense of the amount of data generated from the Internet based communication that we enjoy today.
One final note, I would be remiss if I didn't mention another advancement that has enabled us to generate, store, and process these vast amounts of data, the Cloud. A very short time ago, only the largest organizations could afford the server farms required to handle these large data volumes. But the Cloud has allowed almost any company to leverage high end storage and compute capabilities, without the need to acquire the hardware and software directly. The relative low cost and elasticity of the Cloud has opened up opportunities to smaller organizations that would have not been possible just a short time ago. In fact, about 45% of all businesses are running at least 1 of their big data processes in the Cloud (Source: ZDNet), and double this number use some type of Cloud service. (Source:Forbes)
Let's pause for a moment and raise our glass to those whose contributions (Kahn, Cerf, Lee) helped create the Internet as we know it today, and enabled these amazing technological advancements that have changed our world.
If you believe that the Cloud is just someone else’s computer, and you’d like to learn more, I've found an article on Cloudflare that has a really great summary. Check it out here. It's a pretty easy read and even easier to digest. (unlike those ramen noodles)
The Untapped Value
I‘m sure by this point in the blog post you understand the amount of data we‘re dealing with, and what has caused the surge. The value that this data can bring to an organization is enormous, but unfortunately it remains largely untapped. In fact, analysts estimate that only about 1% of the data that we have available to us is being leveraged for any meaningful purpose. The remaining 99% of this data sits idle. Costing organizations money to store, and costing even more in lost opportunity.
There's a statement that I love, and I wish I could acknowledge who said it first, but unfortunately that too is lost somewhere in the data. The statement is:
Data is the new oil. Like oil, the value of data lies in what you do with it. Unless it's broken down and refined, data has no value.
One thing I would add to the statement above, is that unlike oil. data can be extracted multiple times and processed in many different ways. So in that sense, it's even more valuable than oil, but I'm sure you get the gist of the statement.
Just how impactful is data on a business? Here are a few examples of how leveraging data, or not leveraging it, affects business performance.
- Poor Data Quality costs the US economy up to $3.1 trillion annually. (Source: IBM) Poor data quality leads to bad decision making, missed opportunities, and incorrect business strategies .
- Most organizations are attempting to leverage data. - 97.2% of organizations are investing in Big Data and AI projects to help unlock and leverage data. (Source: New Vantage)
- Businesses that leverage data have an increase in profit of 8% - Plus a decrease in cost of 10%. (Source: BARC Research). Also, 69% cite better strategic decisions. 54% say that their operational processes improved. 52% claimed a better understanding of their customers.
- Netflix saves $1 billion per year in customer retention. (Source: Stratista, Inside Big Data) Investing in it's recommendation algorithm has allowed Netflix to make recommendations to users based on their past viewing habits and interests. This ensures that the content a user is presented with is relevant to his/her interests, thereby increasing the probability that they will not churn out.
- Redroof Inn increased traffic by 10% - By monitoring flight cancellations data (about 3% of flights or 90,000 passengers daily) and then targeting ads at affected travelers, Redroof Inn increased their local business by 10%. In fact, businesses that leverage data effectively are 23x more likely to attract customers and 6x more likely to retain them. (Source: McKinsey Global Institute)
- Data driven businesses grow by 30% per year (Source: Forrester) - In 2021, these businesses are predicted to take about $1.8 trillion annually from their competitors that do not leverage data to drive business decisions.
I'm sure, like all other organizations, you also have data that you should be leveraging more effectively to help guide your business. But where do you begin? What problem(s) are you trying to solve? What do you measure and why should you measure it? Where does the data live and how do you get it? All very good questions, but unfortunately most organizations do not have the answers.
I've worked with hundreds of companies in the past and I've seen a lot of mistakes made when it comes to beginning a data analytics or business intelligence project. I have an image in my mind of an IT department running around with handfuls of data yelling "what can we build with it?!?" But unfortunately the way this plays out time and again is; a set of tools/technologies is acquired, the brain trust huddles together, grabs a bunch of data, develops a dashboard or two, shoves the result in front of their users, and are then flabbergasted when they receive push back and/or nobody uses their life altering creation.
So what happened and how should they have approached this project to ensure that the needs of the users were met and increase the probability of a successful project?
I'll tease this symphony of errors apart in my next blog post and share a process that I have developed over several years called the Business Intelligence Blueprint.
Thanks for reading,
Mike
* Oh, and those 7 'Vs' of big data:
- Volume
- Velocity
- Variety
- Variability
- Veracity
- Visualization
- Value
Continue exploring

July 21, 2026
When a Suite Becomes a Platform
Spend enough time in enterprise software and you’ll eventually notice that certain words begin to lose their meaning. "Innovation" is one of them. "Transformation" is another. Lately, I think "platform" belongs on that l...

December 2, 2025
"AI Duct Tape" Isn't An AI Strategy
Why bolting AI on isn’t the same as building AI-first (and why your product can tell the difference).

June 2, 2025
AI & The Product Manager
Let me begin by stating that I am SUPER excited about Artificial Intelligence (AI) and the possibilities that it provides. The ability of these tools to create images, text, music, computer code, etc. is just mind boggli...